Dashboard
A dashboard is a page where you can display information about your application.
Defining a dashboard
You can define a dashboard with kontrl.dashboard(..).
const kontrl = require("kontrl");

kontrl.dashboard({
  name: "Site metrics",
  items: [
    // Your dashboard items go here
  ]
})
Dashboard items
Dashboard items are the building stones of the dashboard.
Items:
- values Shows a range of values
- lineChart A line chart with 1 or more lines
- barChart A bar chart with 1 or more categories
- custom A custom bar chart item
Values dashboard item
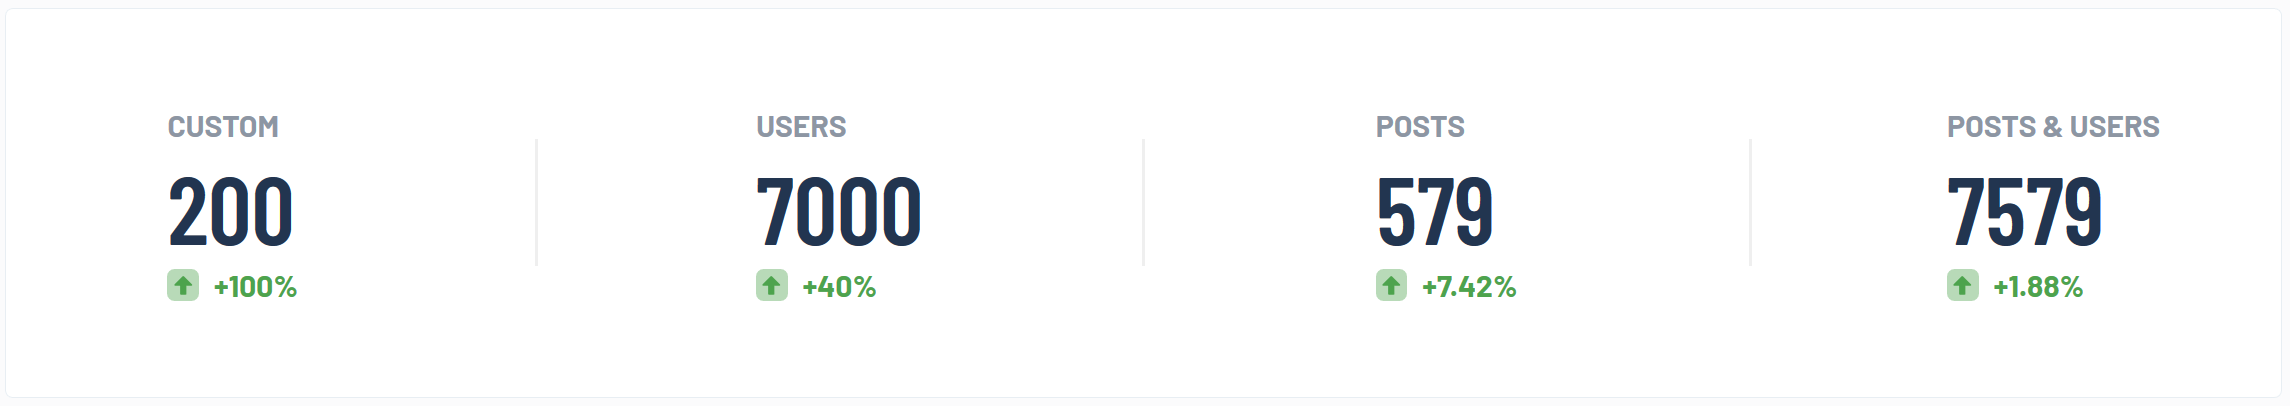
The values dashboard item shows a range of interesting values and how much they have changed in the last 30 days.
You can use a tracker or a custom value function as data.
kontrl.dashboard({
  name: "Site metrics",
  items: [
    // The values item
    kontrl.items.values({
      items: [
      // Use a tracker
        {
          name: "Users",
          tracker: userCountTracker // (See Trackers page)
        },
        // Join values together from a tracker (default)
        {
          name: "Total sales",
          tracker: salesTracker
        },
        // Or average
        {
          name: "Average sale per item",
          tracker: salesTracker,
          joinValuesBy: "average"
        },
        // Only show the sales for 1 item
        {
          name: "Gameboy sales",
          tracker: salesTracker,
          filters: {
            only: ["gameboy"]
          }
        },
        // Or custom data
        {
          name: "Custom",
          customData() {
            // Returns an object with
            //   currentValue -> the value you want to display
            //   oldValue -> a previous value, to display the change tracker (arrow with percentage)
            return { currentValue: 200, oldValue: 10 }
          }
        }
      ]);
    ]
  }
})
Line chart
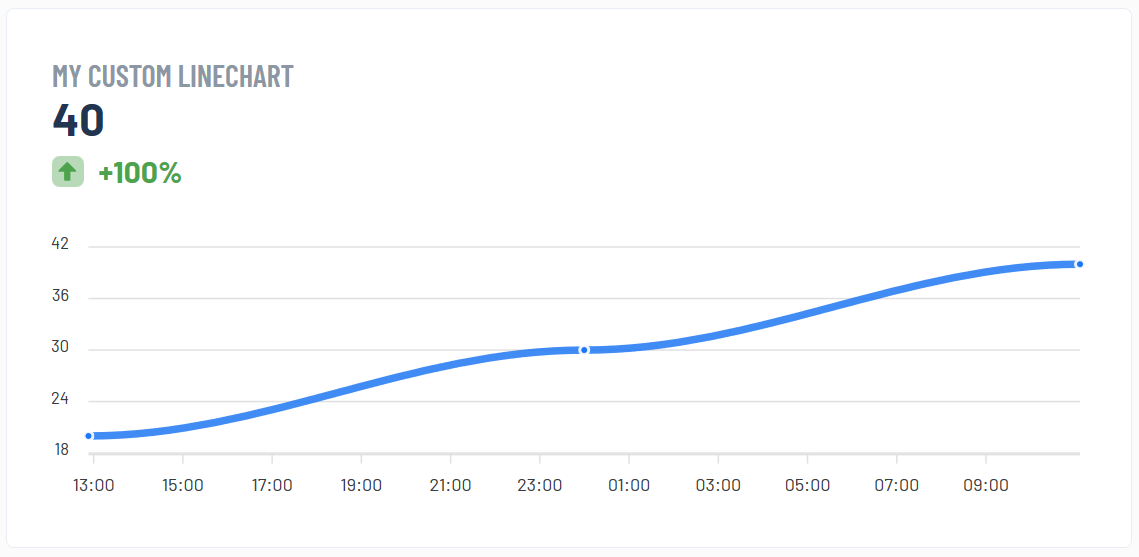
A line graph shows a single or multiple lines representing your data.
kontrl.dashboard({
  name: "Site Metrics",
  items: [

    // Show all route visits
    kontrl.items.lineChart({
      name: "Route visits",
      tracker: routeVisitsTracker
    }),

    // Only show home & about page visits
    kontrl.items.lineChart({
      name: "Route visits",
      tracker: routeVisitsTracker,
      filters: {
        only: ["/home", "/about"]
      }
    }),

    // Show a custom line chart
    kontrl.items.lineChart({
      name: "Custom data",
      customData() {
        return [
          {
            name: "line 1",
            data: [
              // x: timestamp in milliseconds
              // !! List is DESCENDING (by x) AKA newest value first
              { x: 1580584750000, y: 40 },
              { x: 1580564750000, y: 30 },
              { x: 1580544750000, y: 20 },
            ]
          },
          {
            name: "line2",
            data: [
              { x: 1580584750000, y: 35 },
              { x: 1580544750000, y: 30 },
            ]
          }
        ]
      }
    })

  ]
})
Bar chart
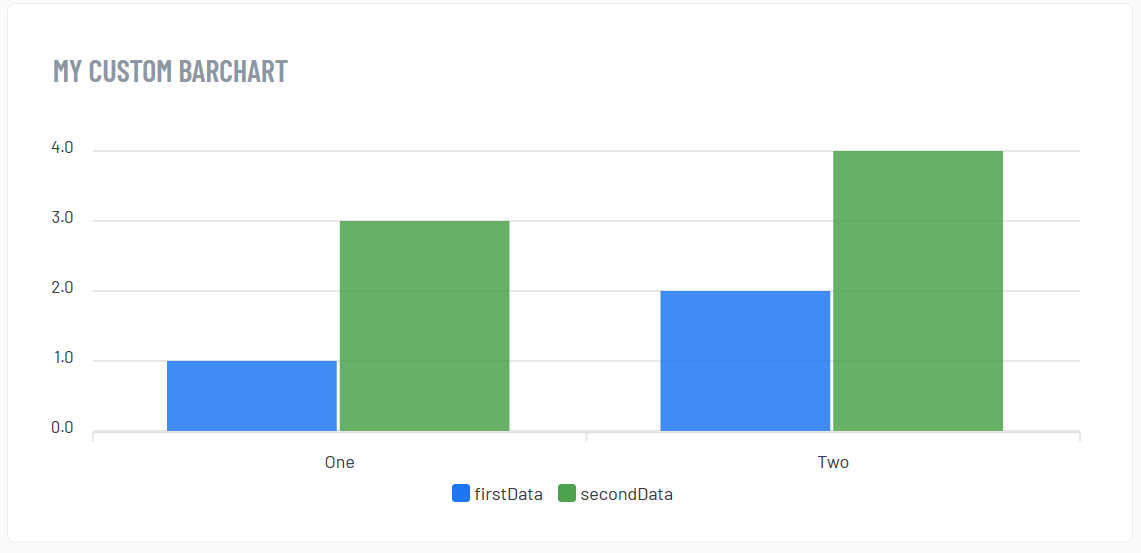
The bar chart uses categories and values within those categories.
There are 2 types:
- split show all types separately
- total add values together to form 1 bar
kontrl.dashboard({
  name: "Site metrics",
  items: [

    // Simply add a tracker
    kontrl.items.barChart({
      name: "Total visits",
      tracker: routeVisitsTracker,
      type: "total", // Join the values
      joinValuesBy: "add" // Join them through addition
    }),

    // Or average them
    kontrl.items.barChart({
      name: "avg visits per route",
      tracker: routeVisitsTracker,
      type: "total", // Join the values
      joinValuesBy: "average" // Join them through averaging
    }),

    // Or show them separately
    kontrl.items.barChart({
      name: "visits",
      tracker: routeVisitsTracker,
      type: "split" // Show them separately
    }),

    // But only show home and about
    kontrl.items.barChart({
      name: "visits",
      tracker: routeVisitsTracker,
      type: "split",
      filters: {
        only: ["/home", "/about"]
      }
    }),

    // Or just show the highest 3
    kontrl.items.barChart({
      name: "visits",
      tracker: routeVisitsTracker,
      type: "split",
      filters: {
        maxValues: 3
      }
    }),

    // And only show the most recent 5 days/hours
    kontrl.items.barChart({
      name: "vists",
      tracker: routeVisitsTracker,
      type: "split",
      filters: {
        maxTimePoints: 5
      }
    }),

    // Or just use your own data
    kontrl.items.barChart({
      name: "Custom",
      customData() {
        return {
          categories: ["Friday", "Saturday"],
          series: [
            {
              name: "barColor1",
              data: [15, 13] // 15 on friday and 13 on saturday
            },
            {
              name: "barColor2",
              data: [30, 0] // 15 on friday and 0 on saturday
            }
          ]
        }
      }
    })

  ]
})
Custom items
If you need any functionality that kontrl doesn’t have, you can make your own dashboard item with a custom Vue component.
kontrl.dashboard({
  name: "Custom items dashboard",
  items: [

    kontrl.items.custom({
      // The custom component, see next part on what these have to look like
      component: myCustomComponent,
      // [Optional] add getData, this data will be loaded when the dashboard loads
      // and sent your custom component
      getData() {
        return ..
      },
      // [Optional] custom settings that will be given to your custom component
      settings: {
        use_version: 3
      }
    });

  ]
})
The custom component needs to be provided as a string.
Given props:
- data return of getData() function (if you have one)
- settings the settings values (if you have them set up)
Example:
const myCustomComponent = `{
  template: "<h1>{{ data }}</h1>",
  props: ["data", "settings"]
}`